How to Check Server Specs in Terminal: The Ultimate Bash Command Guide
Understanding your server’s hardware and software specifications is crucial for performance optimization, security auditing, and capacity planning. Whether you are a system administrator, a DevOps engineer, or a web developer managing a VPS, knowing exactly what is under the hood allows you to make informed decisions about resource allocation and troubleshooting.
In this comprehensive guide, we will explore the most efficient Bash commands to check server specs directly from the terminal. We will start with the popular bench.sh script and then dive into native Linux tools that give you granular control over the data you retrieve.
Why Check Server Specifications?
Before diving into the commands, it is important to understand why you need this data:
- Performance Tuning: Identify bottlenecks in CPU, RAM, or Disk I/O.
- Security Audits: Verify virtualization types and kernel versions for vulnerability patches.
- Billing Verification: Ensure your hosting provider is delivering the promised resources (CPU cores, RAM, Disk).
- Compatibility: Check if your server meets the requirements for software like Docker, Kubernetes, or specific database engines.
Method 1: The All-in-One Benchmark Script (bench.sh)
The bench.sh script is the quickest way to get a comprehensive overview of your server. It is maintained by the Linux community and is widely trusted for its readability.
The Command
wget -qO- bench.sh | bashBreakdown of the command:
wget: A command-line utility for downloading files.-qO-: Suppresses verbose output (-q) and outputs the script to stdout (-O-) instead of saving it to a file.| bash: Pipes the downloaded script directly to the Bash interpreter for execution.
What Does bench.sh Reveal?
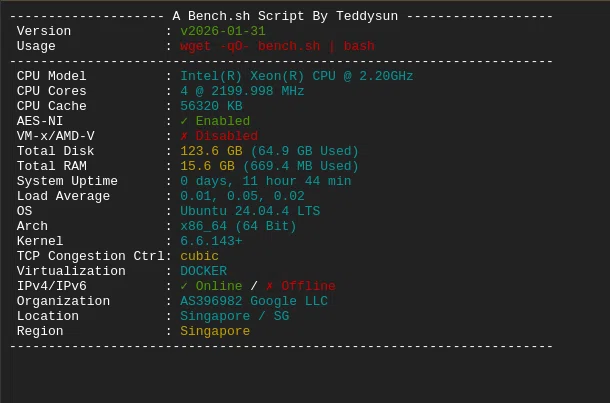
Based on the provided example output, bench.sh provides a structured snapshot covering:
- CPU Model & Architecture: Identifies the processor (e.g., Intel Xeon) and clock speed.
- Cores & Cache: Shows the number of cores and the CPU cache size, which is vital for multi-threading performance.
- AES-NI & Virtualization Support: Checks if hardware acceleration (AES-NI) and virtualization extensions (VM-x/AMD-V) are enabled.
- Memory & Disk Usage: Displays total RAM and disk space alongside current usage.
- OS & Kernel: Identifies the operating system and kernel version (crucial for security patches).
- Network Info: Shows the TCP congestion control algorithm and the organization/hosting provider (e.g., Google LLC in Singapore).
Expert Insight: The
bench.shoutput confirms this specific server is a Docker container on Google Cloud, running Ubuntu 24.04. This information is essential if you are debugging network latency or storage performance issues.
Method 2: Native Linux Terminal Commands
While bench.sh is convenient, you might not always have internet access to download the script, or you might need more specific details. Here are the native commands every Linux user should know.
1. Checking CPU Information
To get detailed information about your CPU, use the /proc/cpuinfo file.
cat /proc/cpuinfoFor a summarized view:
lscpuKey outputs to look for: “Model name,” “CPU(s),” and “Architecture.”
2. Checking Memory (RAM)
To see total, used, and available memory in a human-readable format:
free -hFor detailed memory hardware specs (like speed and type), use:
sudo dmidecode -t memory | grep -i "Speed\|Type"3. Checking Disk Storage
To see disk partition usage:
df -hTo get detailed information about the physical disk (size, model):
sudo fdisk -lOr for virtual disks in a cloud environment:
lsblk4. Checking OS and Kernel
To identify the operating system distribution:
lsb_release -aTo check the kernel version:
uname -rTo check the system architecture (32-bit vs. 64-bit):
uname -m5. Checking Network and Virtualization
To check your network interfaces and IP addresses:
ip addr showTo detect the virtualization technology (KVM, Xen, Docker, etc.):
systemd-detect-virtWhy this matters: The bench.sh output above shows “DOCKER.” If you are running Docker, resource limits are often controlled by the host, which explains why the CPU cache is high but the load average is low.
While bench.sh is excellent, there are dozens of specialized tools that offer unique features—from beautiful visualizations to deep hardware diagnostics. Here is my curated list of the best alternatives, categorized by use case.
Bench.sh command
wget -qO- bench.sh | bash🚀 All-in-One Benchmark & Info Tools
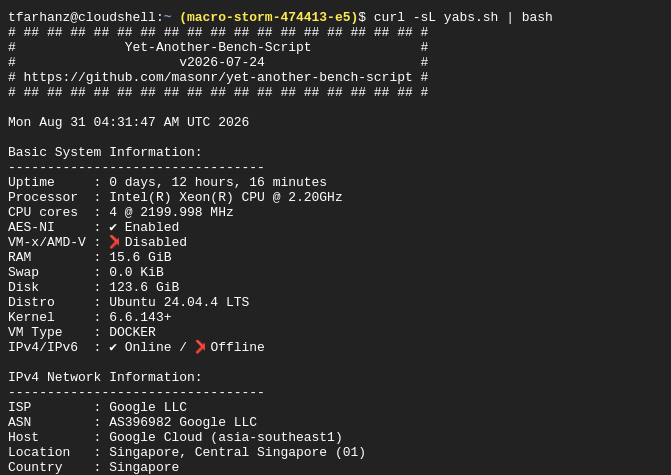
1. yabs.sh (Yet Another Benchmark Script)
The spiritual successor to bench.sh, focused on performance testing.
curl -sL yabs.sh | bash
# or
wget -qO- yabs.sh | bash
What it adds:
- Geekbench 5/6 Integration (optional) – Actually benchmarks CPU performance with a score
- FIO Disk Tests – Measures IOPS (Input/Output Operations Per Second) for 4K, 64K, and 1M block sizes
- Speedtest.net Integration – Tests upload/download speeds to multiple locations
- Color-coded output for easier reading
Best for: Comparing VPS performance across providers (commonly used on LowEndTalk).
2. nbench.sh (Network + Benchmark)
A lightweight hybrid tool.
wget -qO- nbench.sh | bashWhat it adds:
- Network latency tests to 5 global locations
- CPU polynomial arithmetic benchmark
- Memory bandwidth measurement (MB/s)
- Minimal dependencies – works on almost any Linux distribution
Best for: Quick network performance validation.
3. server-review.sh (The Visual One)
Creates a visually stunning, colorized report with ASCII art banners.
curl -sL server-review.sh | bashWhat it adds:
- Neofetch-style aesthetic output
- Temperature sensors data (if available)
- Last system updates list
- Failed systemd services detection
- Log tail for recent errors
Best for: Documentation and generating shareable server snapshots.
🖥️ Native Linux Tools (No External Downloads)
4. inxi (The System Information Swiss Army Knife)
One of the most comprehensive native tools available in most repos.
# Install
sudo apt install inxi -y  # Ubuntu/Debian
sudo yum install inxi -y   # RHEL/CentOS

# Run (Full hardware scan)
inxi -Fxz
What it reveals:
- Detailed graphics/GPU information
- Audio devices and drivers
- Network interface stats (including driver versions)
- RAID status
- Weather! (yes, really –
inxi -w)
Best for: Hardware compatibility checks and driver troubleshooting.
5. lshw (List Hardware)
The gold standard for hardware discovery.
sudo lshw -short    # Compact view
sudo lshw -html > hardware.html  # Export to HTML
What it reveals:
- Motherboard model and BIOS version
- PCI/USB devices tree structure
- Firmware versions for all components
- Physical memory slot mapping (which slot has which RAM stick)
Best for: Identifying exact hardware models for driver installation.
6. dmidecode (BIOS and Hardware Deep Dive)
Reads hardware data directly from the BIOS/EFI.
sudo dmidecode -t system
sudo dmidecode -t memory | grep -i "Speed\|Manufacturer"
sudo dmidecode -t processor
What it reveals:
- Server chassis serial number
- Motherboard manufacturer (Supermicro, Dell, HP, etc.)
- RAM speed, type (DDR3/DDR4/DDR5), and manufacturer
- BIOS release date and version
- Asset tags for enterprise inventory
Best for: Asset management and warranty checks.
🌐 Cloud & Virtualization-Specific Tools
7. cloud-init status & instance metadata
Tools specifically for cloud VMs (GCP, AWS, Azure).
# Google Cloud - Get instance metadata
curl -H "Metadata-Flavor: Google" http://metadata.google.internal/computeMetadata/v1/instance/

# AWS EC2
curl -s http://169.254.169.254/latest/meta-data/

# Generic cloud detection
cloud-init status --wait
What it reveals:
- Cloud provider identity
- Instance type (e.g.,
n2-standard-4) - Availability zone (e.g.,
asia-southeast1-a) - Custom metadata tags set by engineers
- User-data scripts that ran at boot
Best for: Understanding your cloud-specific limitations and pricing.
8. virt-what (Virtualization Detection)
Determines exactly what hypervisor you are running on.
sudo virt-whatWhat it reveals:
- Multiple layers (e.g.,
kvm docker– meaning KVM host running Docker containers) - Hypervisor version (if available)
- VMware tools detection
Best for: Understanding your “computer within a computer” setup.
⚡ Disk & Performance Focused
9. fio (Storage Performance)
Not an info tool per se, but essential for benchmarking.
# Install
sudo apt install fio -y

# Random read/write test (4K blocks)
fio --name=random-rw --ioengine=libaio --rw=randrw --bs=4k --size=1G --numjobs=1 --time_based --runtime=60

# Sequential read test
fio --name=seq-read --ioengine=libaio --rw=read --bs=1M --size=5G
What it reveals:
- IOPS (Read/Write operations per second)
- Latency in milliseconds (microsecond precision)
- Throughput in MB/s
- Whether your disk is SSD or spinning HDD (based on performance patterns)
Best for: Database server optimization (MySQL/PostgreSQL tuning).
10. stress & stress-ng (Load Testing)
See how your server behaves under extreme pressure.
# Install
sudo apt install stress-ng -y

# Stress test all CPU cores for 60 seconds
stress-ng --cpu 4 --timeout 60s --metrics

# Combine CPU + Memory stress
stress-ng --cpu 4 --vm 2 --vm-bytes 80% --timeout 120s --metrics
What it reveals:
- Thermal throttling – does CPU speed drop under load?
- OOM (Out of Memory) killer behavior
- System stability – does the server crash?
Best for: Pre-deployment validation and capacity planning.
📊 Quick Comparison Table
| Tool | No Download? | Shows Disk Speed | Network Test | Virtualization Detection | Best For |
|---|---|---|---|---|---|
| bench.sh | ❌ | ❌ | ❌ | ✅ | Quick daily check |
| yabs.sh | ❌ | ✅ | ✅ | ✅ | VPS Performance comparisons |
| inxi | ✅ | ❌ | ❌ | ✅ | Hardware driver checks |
| lshw | ✅ | ❌ | ❌ | ✅ | Identifying exact hardware models |
| dmidecode | ✅ | ❌ | ❌ | ⚠️ (partial) | BIOS/Asset management |
| fio | ✅ | ✅ | ❌ | ❌ | Database storage tuning |
| stress-ng | ✅ | ❌ | ❌ | ❌ | Stability/capacity testing |
🎯 My Personal Recommendation
For daily system administration: Stick with inxi -Fxz – it’s available on almost every distro, doesn’t require internet, and gives you 80% of what you need instantly.
For VPS comparisons: Use yabs.sh – the disk and network tests are invaluable when comparing hosting providers.
For forensic deep dives: Combine dmidecode + lshw + virt-what – this trio reveals everything about your physical and virtual hardware.
Checking server specs via the terminal is a fundamental skill for any IT professional. While the bench.sh script offers a quick, beautiful, and comprehensive overview—perfect for initial inspections—mastering native Linux commands provides deeper control and security.
Combine these tools. Use bench.sh for a quick weekly health check and native tools for granular troubleshooting. Remember, knowledge of your server’s specs is the first step toward achieving optimal uptime and performance.
⚠️ Security Warning
Always be cautious when piping commands directly to bash:
# DANGEROUS (Never do this without review)
curl -sL UNKNOWN-SCRIPT.sh | bash

# SAFE Practice - Download and inspect first
wget -O script.sh UNKNOWN-SCRIPT.sh
cat script.sh  # Review the code
bash script.sh
📝 FAQ
Q1: What is the safest way to run bench.sh on a production server?
A: While bench.sh is safe, it is best practice to review the script first before piping it to Bash. You can download it using wget bench.sh and open it in a text editor (e.g., nano bench.sh) to ensure there are no malicious commands. For production, use native commands like lscpu and free -h to avoid external dependencies.
Q2: How often should I check my server specs?
A: You should check your specs:
- Initially: Upon provisioning the server to verify the plan.
- Post-Updates: After major OS or kernel updates to ensure compatibility.
- During Incidents: When you experience performance degradation (high load, memory leaks) to understand resource allocation.
Q3: Why does my bench.sh show “DOCKER” but my systemd-detect-virt shows “kvm”?
A: This is because bench.sh detects the current environment. If you run bench.sh inside a Docker container, it will show “DOCKER.” However, the host machine itself might be running on KVM. Run the command on the host (not inside the container) to see the true virtualization.
Q4: How can I check specific hardware details not shown in bench.sh, like RAID configuration?
A: The bench.sh script focuses on OS-level metrics. For hardware RAID information, you need to use vendor-specific tools. For example:
- Dell:
sudo omreport storage vdisk - Software RAID (Linux):
cat /proc/mdstat
If you are in the cloud, RAID is usually handled at the hypervisor level and is not visible to the guest OS.
Q5: Can I run these commands on a macOS terminal?
A: Some commands like lscpu and free are Linux-specific. On macOS, you would use sysctl for CPU/RAM info (e.g., sysctl -n machdep.cpu.brand_string) and df -h for disk space.
Q6: Why does bench.sh show different specs than lshw?
A:bench.sh shows the OS-level view (what the kernel reports). lshw queries the hardware directly through the BIOS/EFI. In virtualized environments (like Docker/KVM), lshw shows the virtualized hardware provided by the hypervisor, while bench.sh shows what the container is allowed to see.
Q7: Which tool is best for checking if I’m on SSD or HDD?
A: Use lsblk -o NAME,ROTA – if ROTA (rotational) is 1, it’s an HDD. If 0, it’s an SSD. For performance confirmation, run yabs.sh or fio.
Q8: How do I save the output to a file?
A: For any command, simply redirect:
curl -sL yabs.sh | bash | tee server-specs.txt  # Shows on screen and saves
inxi -Fxz > specs.txt  # Saves only to file
Q9: Can I run these on shared hosting (no root)?
A: Most tools require sudo or installation. However, bench.sh, yabs.sh, and nbench.sh run with user permissions (no root needed) and are the safest options for shared environments.
Q10: What’s the lightest tool for very old/low-spec servers (128MB RAM)?
A: Use uname -a + free -m + df -h – it’s native and uses almost zero resources. If you want an automated script, server-review.sh is extremely lightweight compared to bench.sh.